Is it possible to determine the way a county will vote based on data from the US Census Bureau? I explored the data available and ran several categorical models against the results of the last two presidential elections.
The Data
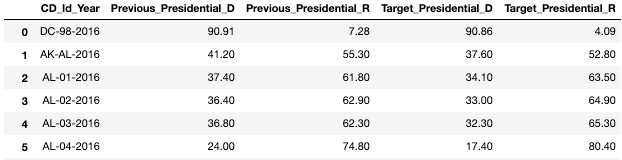
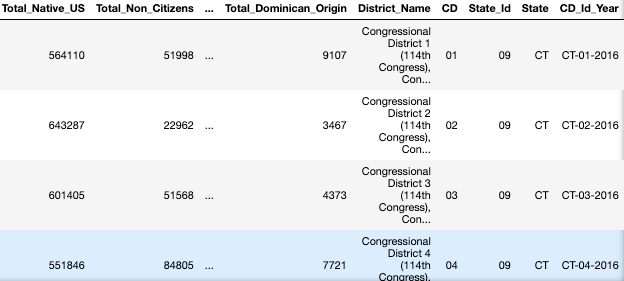
The US Census Bureau website hosts an API where you can access their data. There are several surveys available on the API, I chose to use the annual version of the “American Community Survey” (ACS) for my analysis. This survey allows you to zero in on data by location, however the data for numerous counties is missing. Fortunately the data on the congressional district level is readily available. The US Census API contains data from 2010 forward, which means that I can only look at the 2012 and 2016 presidential elections. There are tens of thousands of variables to choose from in the ACS, I go through the process of narrowing them down below. I obtained the congressional district level election results from an excel file by Stephen Wolf, a reporter for the Daily Kos. The county result is my target variable; 1 means that the county voted for the Republican presidential candidate and 0 means the Democrat candidate.
There are 860 total rows that correspond to a congressional district and a specific election year (either 2012 or 2016). There are 435 total congressional districts; five of these districts correspond to US territories who do not vote in US presidential elections (430 voting districts * 2 electoral years = 860 total observations for this study).
The ACS contains tens of thousands of rows of data. For instance they break down commuters by mode of transportation and the hour that they are in transit. This highly specific information is not necessary for my categorical models. I stick to overarching demographic and employment data; the specifics are in the next section.
EDA
I began by exploring the correlation between the 46 features and target variable. In the upper-right hand corner of the correlation matrix below is a histogram of the target variable.
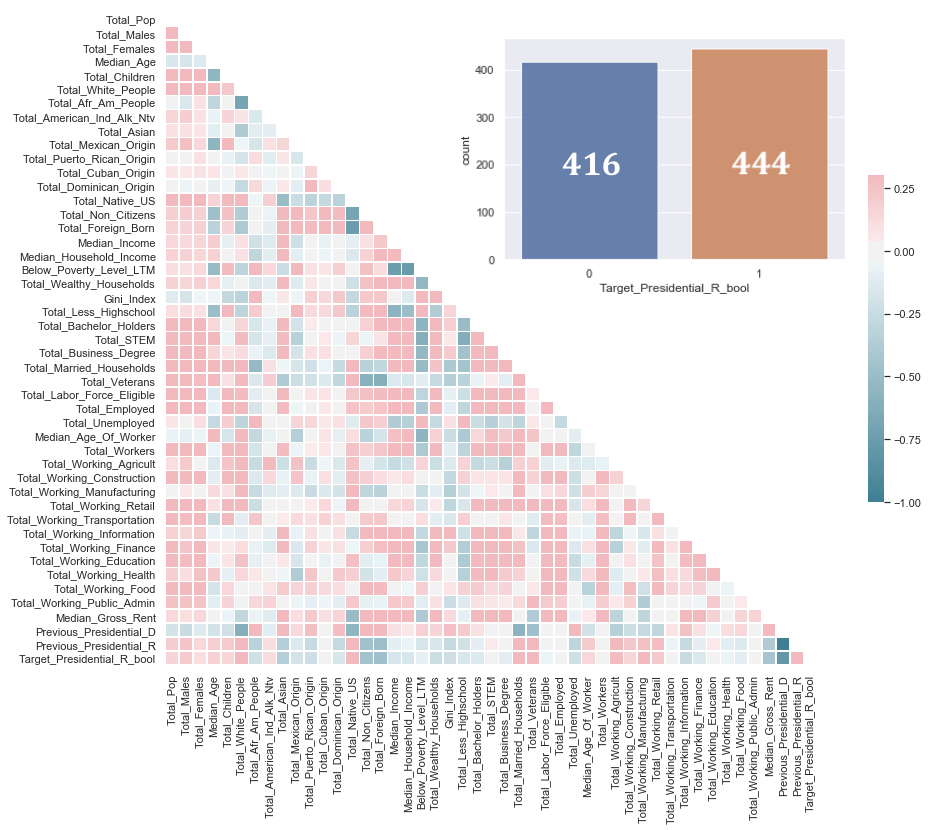
According to the correlation matrix, there are few features with a high positive correlation and voting for the Republican Party (the scale maxed out at 0.25), however there are several features with a correlation of -0.6. Among the strongest positively correlated features with districts and voting for the Republican Party are: total veterans, total married households, total white citizens, total native born residents, total workers in the agriculture field, and total workers in the manufacturing industry. Among the strongest negatively correlated features with districts and not voting for the Republican Party are: total non-citizens, total foreign-born residents and median gross rent.
I perform feature engineering as well. For instance I convert the numerical industry features to categorical features. If more than 10% of the workforce is concentrated in an industry the feature is given a value of 1, or else the value is 0.
The Models
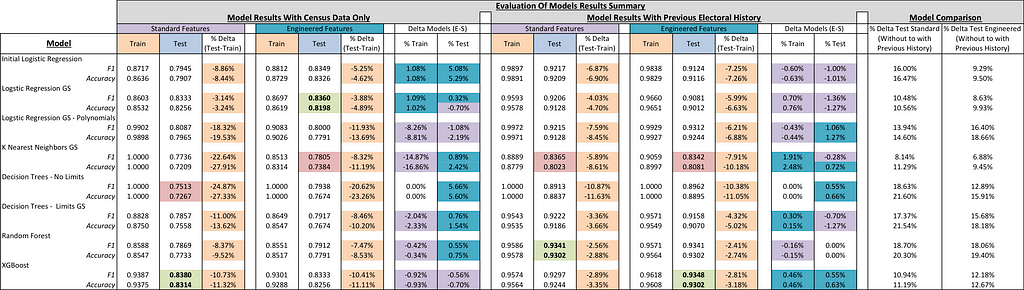
I ran eight models both with and without the results of the previous election (the 2012 district will have the 2010 midterm results for the previous election variable). The results table is broken up into four categories: (1) models performed with census data and the standard features data frame, (2) models performed with census data and the engineered features data frame, (3) models performed with census data, previous presidential election results, and the standard features data frame, (4) models performed with census data, previous presidential election results, and the engineered features data frame. The scores highlighted in green represent the highest performing model in each category and the scores highlighted in red represent the lowest performing model in each category, according to their F1 scores.
Each model allocated the 860 congressional districts between training and testing data sets. The test size for each model was set to 20% of the data with the exception of the first logistic model (25%). As expected, every model performed better on their training data than their test data set, the percent difference is highlighted in orange in the column titled ‘% Delta (Test-Train)’. The column ‘Delta Models (E-S)’ appears twice and lists the improvement in F1 and accuracy score for each model between the engineered and standard data frame. The far right column titled ‘Model Comparison’ lists the percentage improvement the inclusion of each congressional district’s previous presidential electoral results has on the models; a column is included for the data frames with standard features and engineered features. The range of improvement in the F1-scores is between 18.70% and 6.88%. I list the top performing models below (Please open the table in a new window to view it clearly):
1. Census Data Only – Standard Features: XGBoost (F1: 0.8380)
2. Census Data Only – Engineered Features: Logistic Regression GS (F1: 0.8360)
3. Census and Previous Election Results Data – Standard Features: Random Forest (F1: 0.9341)
4. Census and Previous Election Results Data – Engineered Features: XGBoost (F1: 0.9348)
Part 4: Key Takeaways
The XGboost, Random Forest and Logistic Regression models with grid search performed best on the data set. K-Nearest Neighbors scored the lowest F1 score.
The percentage of votes cast for the previous Republican presidential candidate improved my models’ F1 scores between 6.88% and 18.70%. Without the previous vote included the models were still able to perform well on census data alone. The features that mattered the most after electoral history was removed were mostly about income, industry employment, education and country of origin. Only the race based feature ‘Total_White_People’ remained in the top ten features when previous electoral history was removed. Although census data can predict the congressional district’s voting patterns fairly well, what each political party represents and the presidential candidate of the political party account for the small inaccuracies of these models. In swing states these can cause slight differences in the popular vote, which will lead to major differences in the electoral votes.
The GitHub repository link is here.